Page 1 of 1
Graphing Data
Posted: Fri Oct 19, 2012 10:33 pm
by Eugene529
Is there a way to create x,y data graphs (Floating point numbers)?
Re: Graphing Data
Posted: Sat Oct 20, 2012 9:34 am
by support
There is a Graph Module in FlowStone that takes an array of floats and draws a graph. If you look at the FFT Module you will see how it is done.
eg.
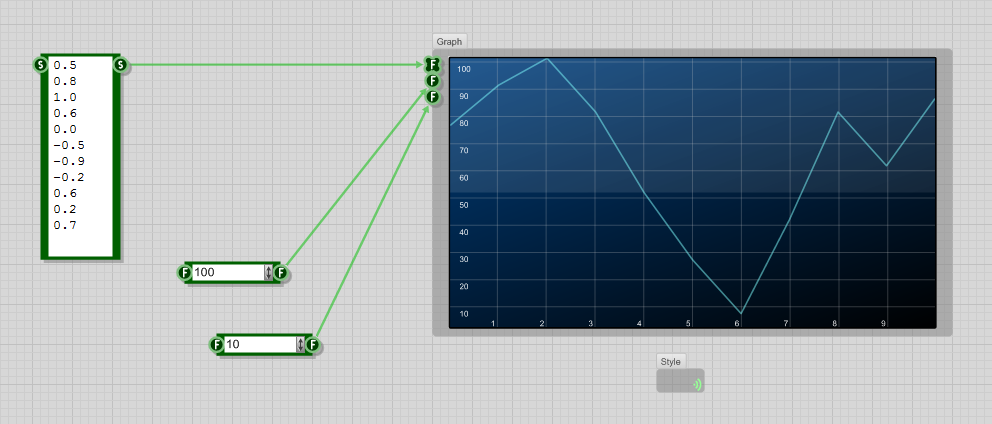
- Graph clip.png (92.82 KiB) Viewed 18081 times
Re: Graphing Data
Posted: Mon Oct 22, 2012 4:37 pm
by Eugene529
These displays appear to output a graph of a floating point variable and time. Is there a way to graph two independent variables?
Re: Graphing Data
Posted: Mon Oct 22, 2012 5:08 pm
by Eugene529
I would guess that the function I need to experiment with is the Point Array Lines. I this correct?
Re: Graphing Data
Posted: Mon Oct 22, 2012 8:22 pm
by support
Yes correct but now we have Ruby there is a better way:
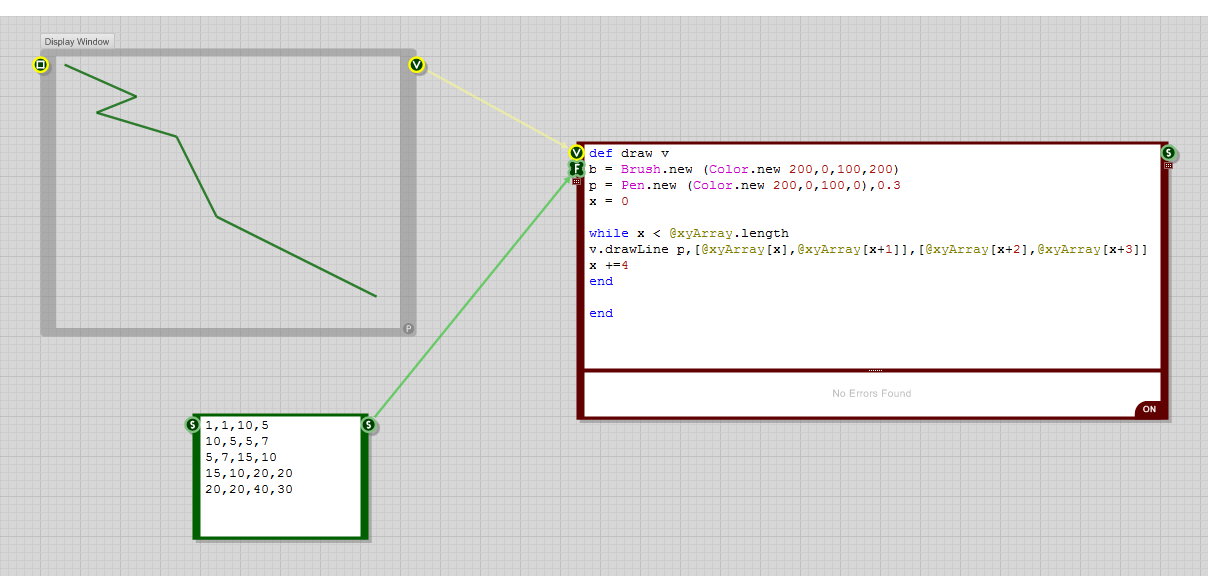
- Ruby Graph clip.png (55.1 KiB) Viewed 18082 times
Re: Graphing Data
Posted: Fri Feb 28, 2014 11:04 pm
by aronb
I need to graph the output of 2 oscillators (think lissajous)...
I could use the Point Array Lines but it auto scales the graph...

Please, how do you stop it from auto scaling?
I want the graph to be scaled at -1 to 1 on both axis regardless of what I input... as may signal (pattern) gets small I want to see it get small NOT have the graph automatically "gain up".
Very frustrating.
Aron
Re: Graphing Data
Posted: Sat Mar 01, 2014 5:47 am
by Jay
Do you want it to be scaled in size comparible to the volume/level of the signals?
like this?
Re: Graphing Data
Posted: Mon Mar 03, 2014 4:40 am
by aronb
Well I guess... this works to some extent.
The use of the envelope to calculate the area based on the x signal (or y or both) makes it work for some frequency. As the frequency is lowered the scope becomes jittery.
Thanks for the fix, it is quite ingenious!
I was hoping that a version existed that did not "autoscale" and did not need to be "tricked".
I included an offset to show the remaining issue...
We just need a good XY Display with color capability... like an old Vector Monitor - think old school arcade vector games. Or again the Point Array Lines module WITHOUT "autoscale"... I can't even think why you would want a module to falsely add gain to something you want to display in the first place.
Thanks for the help,
Aron